Metrics dashboard
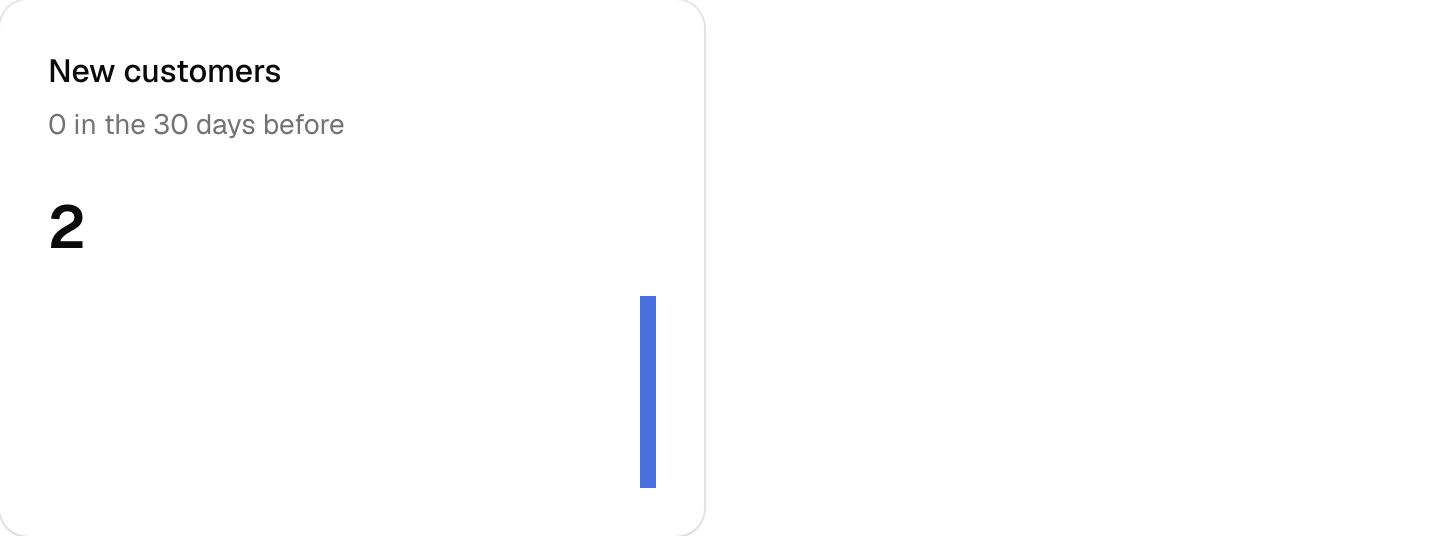
A card per metric: the 30-day total against the 30 days before, with daily bars. It loads its data on the server through the block's client.
Add the components
terminal npx shadcn add alert badge button card empty skeletonInstall the glue
Install the block with
npx better-supabase add metrics. The glue items are copied into your app, so edit them as you need.None: the page calls the block's client on the server.
Write the screen
React and shadcn
View in the examplemetrics-dashboard.tsx import { toChartData, type Kpi, type MetricChartRow, } from "better-supabase/blocks/metrics"; import { tenantOf } from "better-supabase/next"; import { ChartColumnIcon, TriangleAlertIcon } from "lucide-react"; import { getExtracted, getFormatter } from "next-intl/server"; import { refresh } from "next/cache"; import { unstable_rethrow } from "next/navigation"; import { Temporal } from "temporal-polyfill"; import { Alert, AlertAction, AlertDescription, AlertTitle, } from "@/components/reui/alert"; import { Badge } from "@/components/reui/badge"; import { Button, buttonVariants } from "@/components/ui/button"; import { Card, CardAction, CardContent, CardDescription, CardHeader, CardTitle, } from "@/components/ui/card"; import { Empty, EmptyContent, EmptyDescription, EmptyHeader, EmptyMedia, EmptyTitle, } from "@/components/ui/empty"; import { Skeleton } from "@/components/ui/skeleton"; import { getSession } from "@/features/user/user-queries"; import { Link } from "@/i18n/navigation"; import { blocks } from "@/lib/blocks"; import { bs } from "@/lib/supabase/server"; import { metrics } from "@/metrics"; const DAYS = 30; const DAY_MS = 86_400_000; type MetricKey = (typeof metrics)[number]["key"]; interface MetricPanel { readonly key: MetricKey; readonly kpi: Kpi; readonly rows: readonly MetricChartRow[]; } type Dashboard = | { readonly kind: "ok"; readonly panels: readonly MetricPanel[] } | { readonly kind: "error" }; /** * Every metric in `src/metrics.ts` over the last 30 days: the total against * the 30 days before, and one point per day. Cached per session; the * metrics module checks `metrics.read` on each read. It throws on a failed * read, so a failure is never cached and Retry reads again. */ async function loadPanels( organizationId: string, ): Promise<readonly MetricPanel[]> { "use cache: private"; const { supabase } = await bs.cached(); const until = Temporal.Now.instant(); const range = { from: until.subtract({ milliseconds: DAYS * DAY_MS }), until, }; const client = blocks(supabase).metrics; return Promise.all( metrics.map(async ({ key }) => { const [kpi, series] = await Promise.all([ client .kpi(key, range, { organizationId, compare: "previous" }) .orThrow(), client.series(key, range, { organizationId, grain: "day" }).orThrow(), ]); return { key, kpi, rows: toChartData(series) }; }), ); } async function loadDashboard(organizationId: string): Promise<Dashboard> { try { return { kind: "ok", panels: await loadPanels(organizationId) }; } catch (error) { unstable_rethrow(error); return { kind: "error" }; } } // oxlint-disable-next-line typescript/require-await -- a Server Action must be async, and refresh() returns nothing to await async function retry() { "use server"; refresh(); } /** Render inside `<Suspense>`: a card per defined metric, with its daily bars. */ export async function MetricsDashboard() { const organizationId = tenantOf(await getSession()); if (!organizationId) { return null; } const [dashboard, t, format] = await Promise.all([ loadDashboard(organizationId), getExtracted("metrics"), getFormatter(), ]); if (dashboard.kind === "error") { return ( <Alert variant="destructive"> <TriangleAlertIcon /> <AlertTitle>{t("The metrics didn't load")}</AlertTitle> <AlertDescription>{t("Try again in a moment.")}</AlertDescription> <AlertAction> <form action={retry}> <Button size="sm" variant="outline" type="submit"> {t("Retry")} </Button> </form> </AlertAction> </Alert> ); } if (dashboard.panels.every((panel) => (panel.kpi.value ?? 0) === 0)) { return ( <Empty className="border"> <EmptyHeader> <EmptyMedia variant="icon"> <ChartColumnIcon /> </EmptyMedia> <EmptyTitle>{t("No data in the last 30 days")}</EmptyTitle> <EmptyDescription> {t("Add a customer and its metric shows up here.")} </EmptyDescription> </EmptyHeader> <EmptyContent> <Link href="/customers" className={buttonVariants()}> {t("Add a customer")} </Link> </EmptyContent> </Empty> ); } const labels: Record<MetricKey, string> = { customers: t("New customers") }; return ( <div className="grid gap-4 lg:grid-cols-2" data-testid="metrics-dashboard"> {dashboard.panels.map((panel) => { const { change, trend, value, previous } = panel.kpi; const max = Math.max(1, ...panel.rows.map((row) => row.value ?? 0)); return ( <Card key={panel.key}> <CardHeader> <CardTitle>{labels[panel.key]}</CardTitle> <CardDescription> {t("{previous} in the 30 days before", { previous: format.number(previous ?? 0), })} </CardDescription> {change === null || change === undefined ? null : ( <CardAction> <Badge variant={ trend === "up" ? "success-light" : trend === "down" ? "destructive-light" : "secondary" } > {format.number(change, { style: "percent", signDisplay: "exceptZero", })} </Badge> </CardAction> )} </CardHeader> <CardContent className="flex flex-col gap-4"> <span className="text-3xl font-semibold tracking-tight tabular-nums"> {format.number(value ?? 0)} </span> <div aria-hidden="true" className="flex h-24 items-end gap-0.5"> {panel.rows.map((row) => ( <div key={row.date} title={`${format.dateTime(new Date(row.date), { dateStyle: "medium" })}: ${format.number(row.value ?? 0)}`} className="h-full flex-1 origin-bottom scale-y-(--bar) bg-primary/80" // SAFETY: React's CSSProperties has no custom properties; --bar is a number. style={{ "--bar": (row.value ?? 0) / max } as CSSProperties} /> ))} </div> </CardContent> </Card> ); })} </div> ); } export function MetricsDashboardSkeleton() { return ( <div className="grid gap-4 lg:grid-cols-2" aria-busy="true"> {metrics.map(({ key }) => ( <Skeleton key={key} className="h-64 rounded-xl" /> ))} </div> ); }